 freebirdcapital
A multiple condenses a valuation into one number: quick to calculate, easy to compare. That is exactly the risk. Behind every P/E lie assumptions about growth, risk and interest rates that you cannot see when looking at the number alone. Multiples are tools in a toolbox, not verdicts.
What the P/E measures
Inverse: earnings yield = earnings per share ÷ share price = 1 ÷ P/E
A P/E of 15 means: I pay fifteen times the current annual profit. For a controller the translation is obvious — with constant earnings, the P/E is the payback period in years. What matters is which earnings are meant: last year's, a forecast for next year, reported or adjusted for one-offs. Two P/Es are only comparable if they refer to the same earnings.
Earnings yield: the P/E in percent
Often more telling than the P/E itself is its inverse. The earnings yield can be compared directly with the risk-free rate — and shows how much growth the price already assumes.
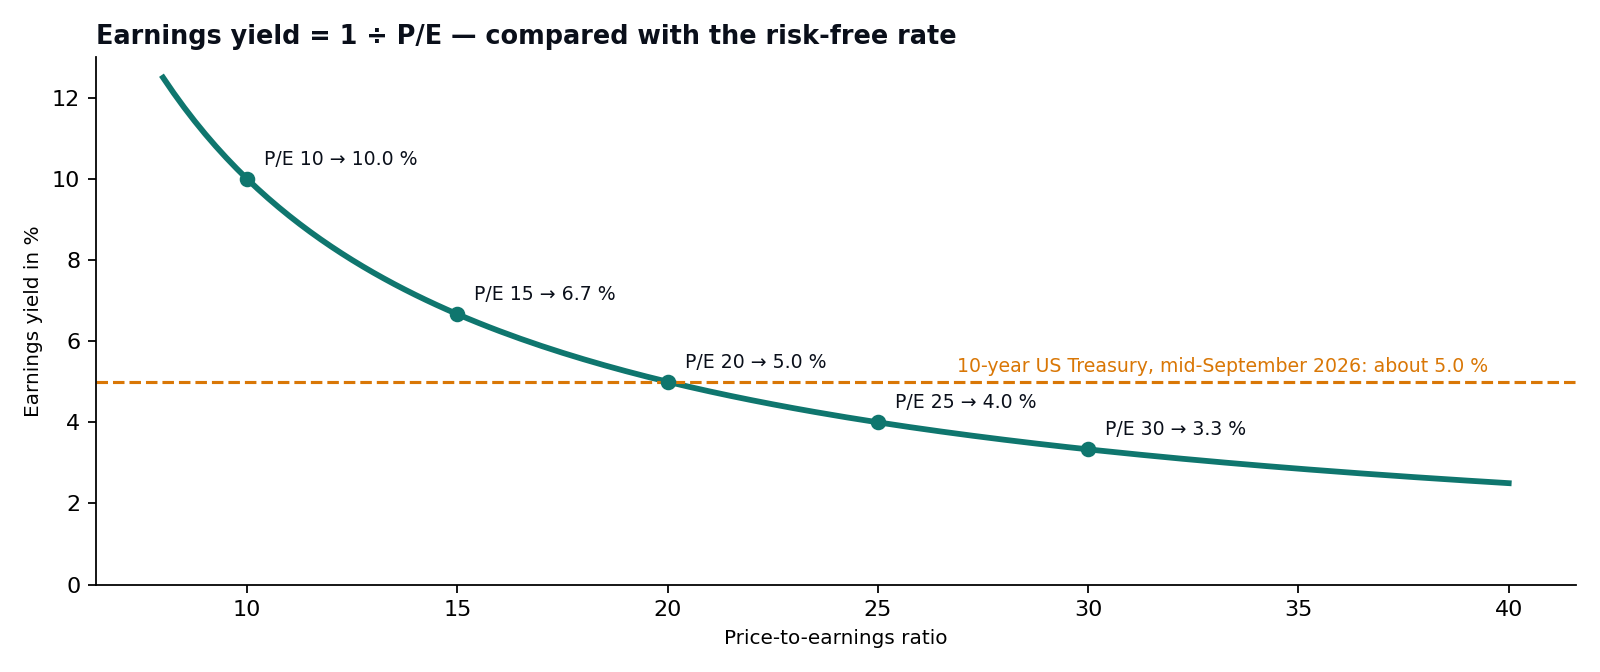
With a bond yield of about 5 %, the threshold is a P/E of 20: above it, the share earns less today than the safe bond and must make up the gap through growth. That is not a ban, but a clear question for every valuation: how much growth is already in the price? Where the interest rate in this calculation comes from is covered in the article on the yield curve.
Which earnings? The blended P/E
A P/E on last year's earnings ages with every month; a P/E on the current-year estimate rests on a forecast. A blended P/E combines both: with each month after the fiscal year-end, the earnings base shifts by one twelfth from the last reported figure to the current estimate. Six months after year-end, both count half. The metric thus stays comparable across the year without relying entirely on analyst estimates. The fair value calculator works exactly this way.
Accounting for growth: PEG and Graham's rule of thumb
A high P/E can be justified if earnings grow fast. The PEG ratio relates the two: P/E divided by the expected growth rate in percent. A PEG around 1 is considered fair for growth companies — a P/E of 20 at 20 % growth as well as a P/E of 12 at 12 %. From this I derive my yardstick for a fair P/E: at most 15 for companies growing up to 15 %, above that a P/E equal to the growth rate. The 15 is a cap, not a floor: when interest rates are high, the fair P/E falls to 100 ÷ (risk-free rate + premium) — at a 5 % bond yield and a 2.5-point premium to 13.3. The premium is a matter of judgement; the fair value calculator leaves it open.
Benjamin Graham, original version: intrinsic value ≈ EPS × (8.5 + 2 × growth in %)
Both rules serve as plausibility checks, not as valuations. They assume the growth continues, and they ignore how much capital it costs. A company growing 10 % that must reinvest every euro it earns is worth less than one achieving the same growth with half — the difference lies in the return on capital.
Where the P/E misleads
- Cyclical companies: the P/E is lowest when earnings peak — often just before they fall. Average earnings over a cycle help here.
- One-off effects: a disposal gain or a write-down distorts annual earnings. Adjust first, then calculate.
- Losses: a negative P/E is meaningless; then only sales or cash-flow measures work.
- Debt: two companies with the same P/E can carry very different risk. Enterprise value to EBIT includes debt.
The other tools in the box
| Multiple | Formula | Useful for |
|---|---|---|
| P/CF | price ÷ operating cash flow per share | high depreciation, when earnings understate cash generation |
| P/S | price ÷ sales per share | loss-making phases and young companies — only with an eye on margin |
| P/B | price ÷ book value per share | banks and asset-heavy businesses; weak with intangible assets |
| EV/EBIT | enterprise value incl. debt ÷ operating profit | comparing differently financed companies |
No multiple suffices on its own. I compare every figure with the company's own history and with direct competitors, and use it as an entry into the question that counts in the end: what future earnings am I paying for with this price?
Foundations: B. Graham: The Intelligent Investor and Security Analysis (original valuation formula); A. Damodaran: The Dark Side of Valuation; bond yield per Federal Reserve H.15 (FRED series DGS10), mid-September 2026.