 freebirdcapital
The article Six steps to your own buy list describes the process. The WatchList is the tool for steps 3, 5 and 6 (the full rating from step 4 stays in the Freebird Rating): from the recorded metrics it calculates points, fair value, buy price and crash limit, shows a traffic light for each stock and the gate it is currently stuck at — and records why I bought or deliberately did not buy. Decisions follow rules that are fixed in advance, not the price chart of the day.
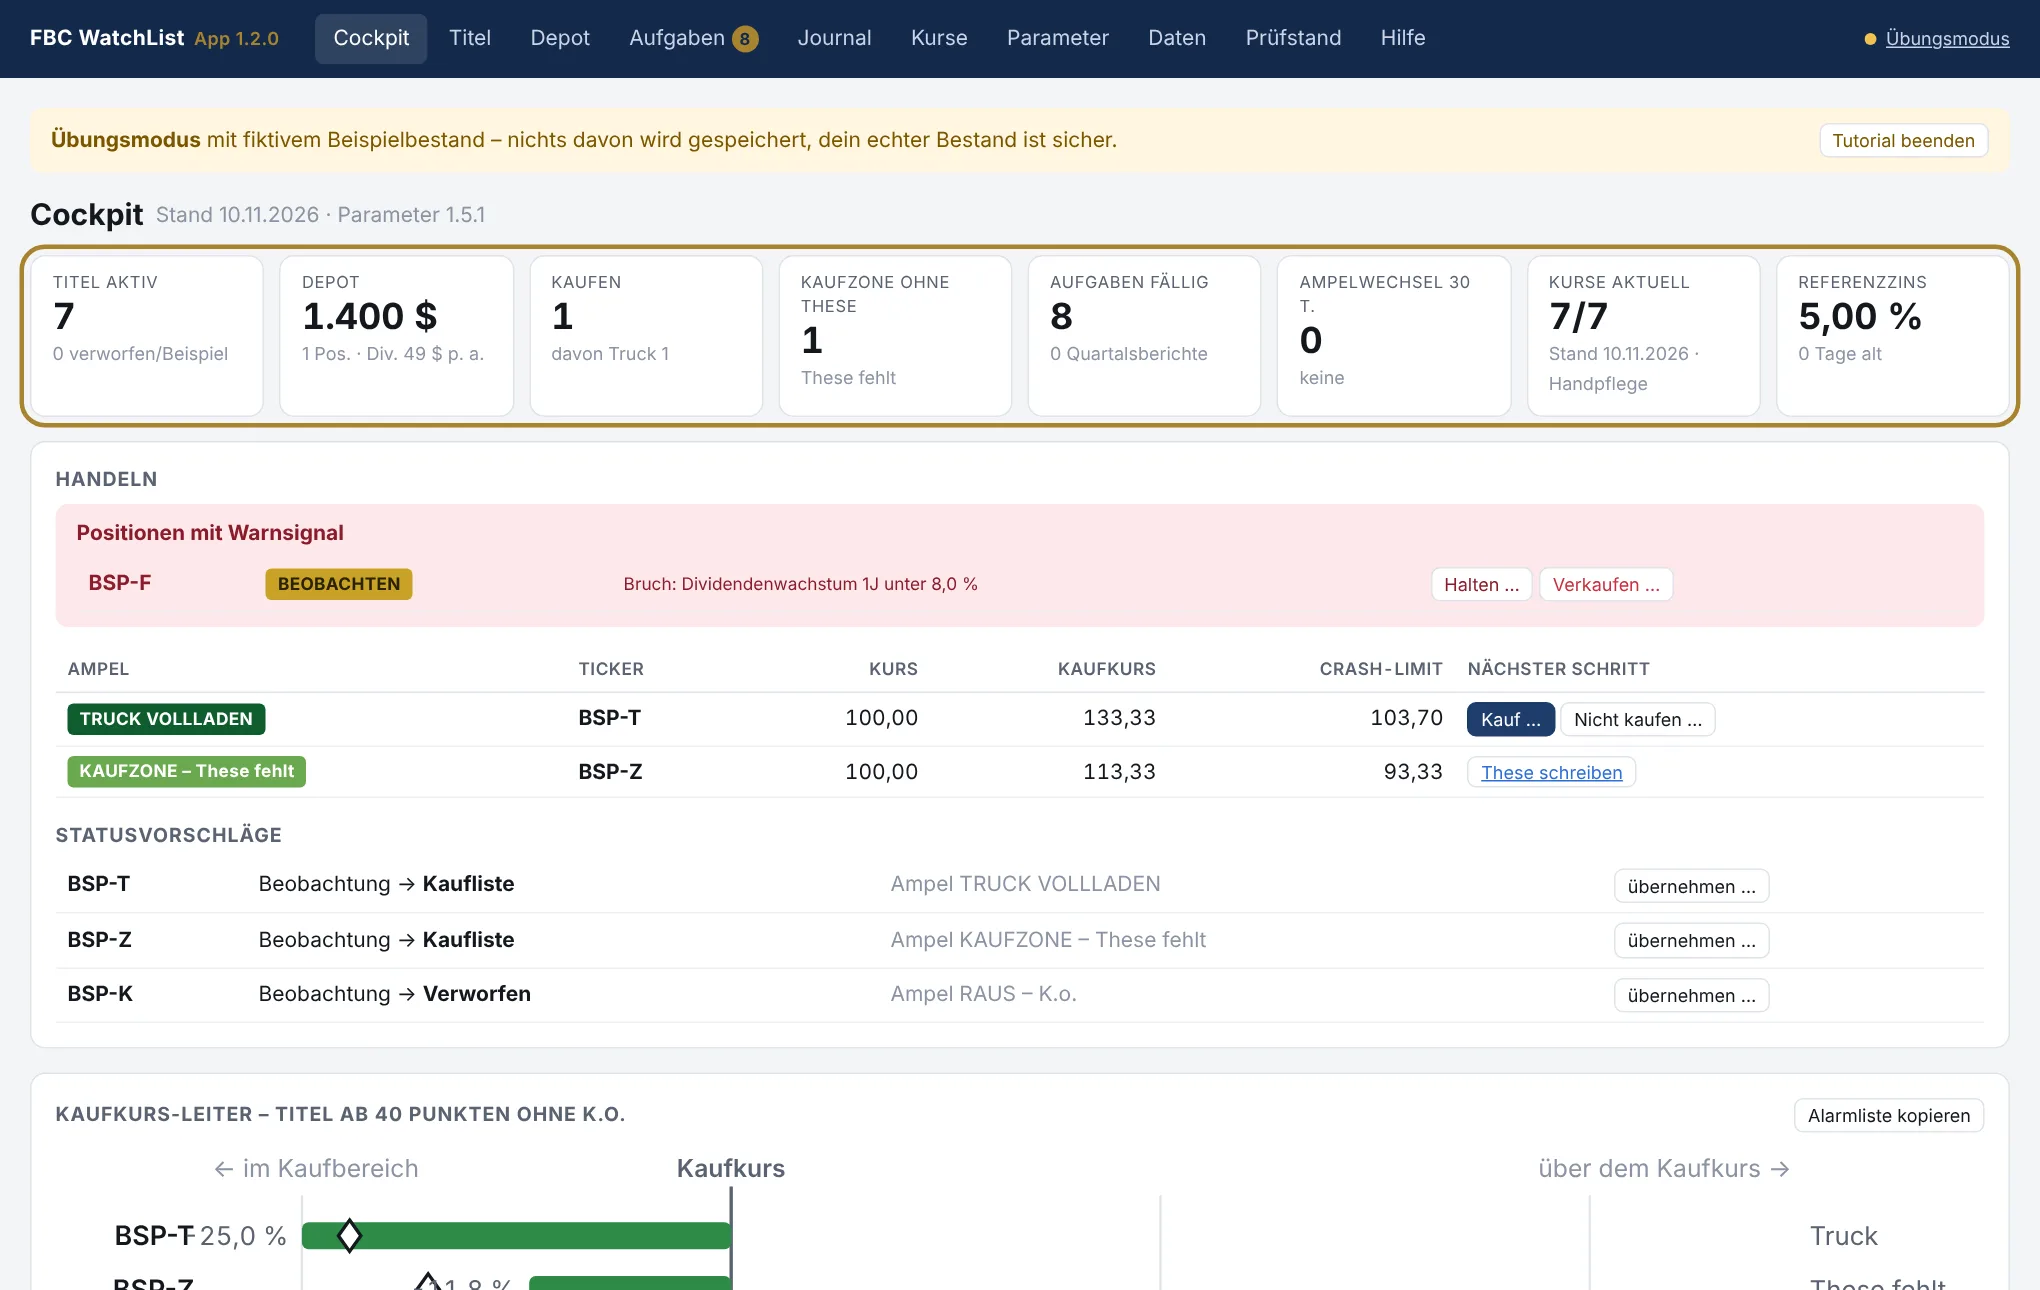
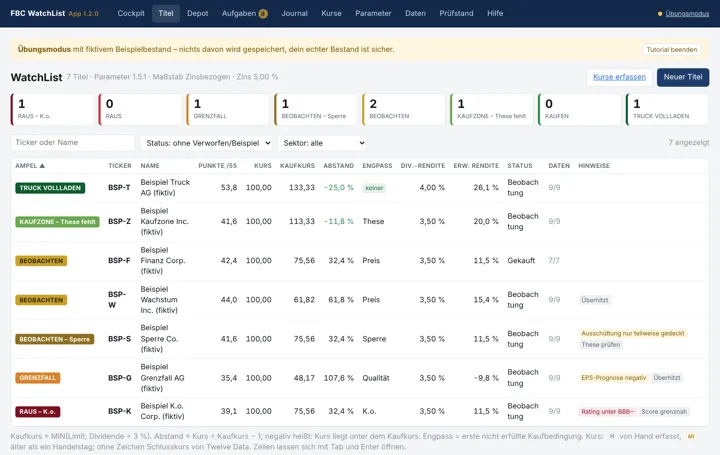
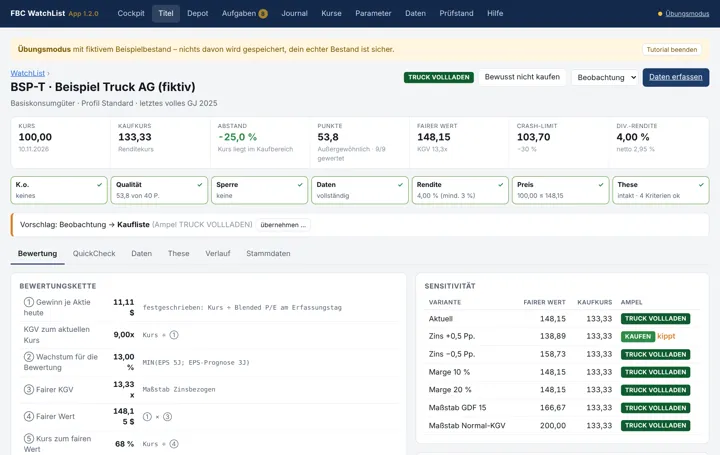
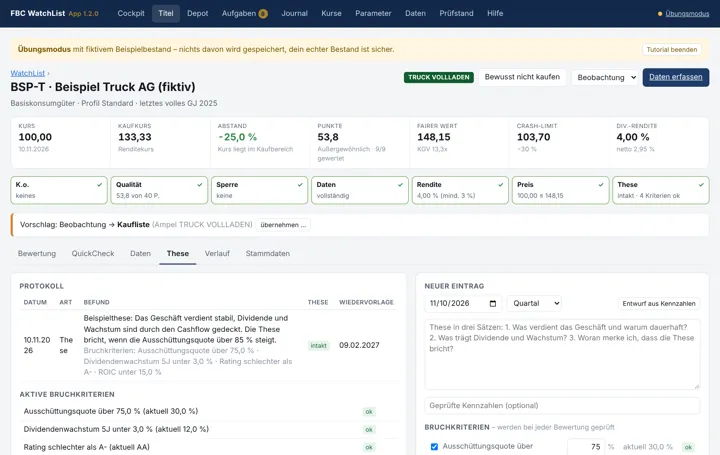
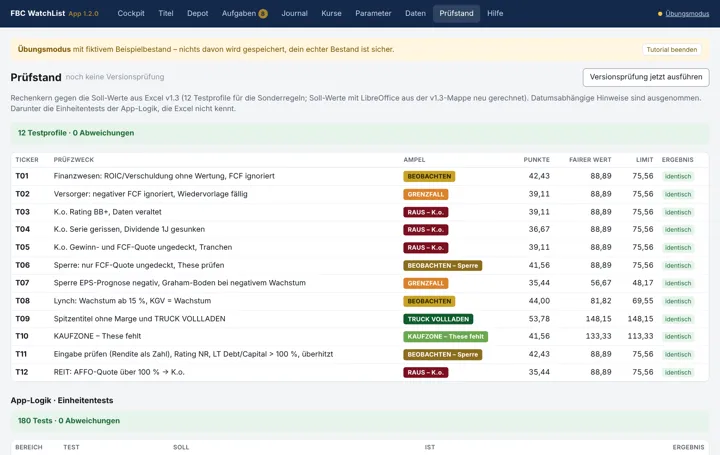
The screenshots show the app's practice mode in German with fictitious sample stocks („Beispiel Truck AG (fiktiv)“ etc.) and rounded model values. No real stocks, no own positions and no price targets are shown.
Seven gates to a buy signal
Every stock passes the same checks in a fixed order. The first gate that is not open is the bottleneck — it is shown next to each stock in the list and tells me what to do next.
- Knock-out
- Quality
- Block
- Data
- Yield
- Price
- Thesis
| Traffic light | Meaning | Next step |
|---|---|---|
| OUT – knock-out | Rating below BBB−, dividend streak broken or payout not covered | discard |
| OUT | below 32 of 55 points | discard |
| BORDERLINE | 32 to below 40 points | wait for the next data update |
| WATCH – blocked | Quality is sufficient, but data are preliminary or incomplete, the earnings forecast is negative or the payout only partly covered | resolve the block |
| WATCH | Price above the buy price or dividend yield below 3 % | set an alert at the buy price |
| BUY ZONE – no thesis | Price in the buy zone, but no confirmed thesis | write the thesis |
| BUY | all seven gates open | buy or deliberately pass, both with a reason |
| LOAD THE TRUCK | Price at or below the crash limit (fair value − 30 %) | buy, in tranches if needed |
The valuation chain
The buy price comes from a few traceable steps. The points come from the quick test of the Freebird Rating, the fair value follows the fair value calculator — same formulas, same thresholds.
| Figure | Rule |
|---|---|
| Earnings per share | price ÷ blended P/E on the day of recording, then fixed |
| Growth | the lower of 5-year earnings growth and the 3-year forecast |
| Fair P/E | 100 ÷ (rate + 2.5 points), at most 15; from 15 % growth P/E equals growth, adjusted to the rate and at most 20 |
| Limit | fair value − 15 % margin of safety; top stocks from 83 % of points without margin |
| Yield price | dividend per share ÷ 3 % |
| Buy price | the lower of limit and yield price |
| Crash limit | fair value − 30 % |
Why an app and not just a spreadsheet
| Component | What it does |
|---|---|
| Journal | Every purchase, deliberate pass, status change and sale with a reason — the basis for measuring my own hit rate later |
| Tasks | Derived from the holdings (review due, break criterion triggered, data older than 100 days) and gone as soon as the cause is resolved |
| Parameter versions | Every rule change becomes a new version, with a preview of which traffic lights flip |
| Test bench | On the first start of every new version, all test profiles run against the Excel template, plus all unit tests |
| Data states | Every state carries a SHA-256 checksum; damaged states are detected, restoring creates a new state |
| Local | One HTML file; data stay in the browser or in a chosen folder. Prices and the reference rate come via my own access to Twelve Data and FRED |
I enter the fundamentals by hand from the services I use anyway. They are not passed on — which is why the app is only shown in practice mode.